INSTITUTE OF PHILOSOPHY OF NATURE
Abstract
Electric phenomena in atmosphere of the earth and other celestial bodies are quite conspicuous. Ionisation of atmospheric constituents by solar ionising radiation, external cosmic rays and rays from radioactive materials as well as the direct entry of charge particles from the solar wind and their guided motion in the geomagnetic field goes to explain the electric phenomena of the atmosphere of the earth. The present ionospheric studies allow the ionospheric shells to be quasineutral. As of today we do not assume any of the ionospheric shells to be negatively or positively charged. In contrast to the present understanding, this paper identifies the specific charge state of different ionospheres and their nature of placement. A remarkable correlation of alternate reversal of charge polarity and the outwardly expanding ion shell spacing in GP series has been worked out based on data available in literature.
Introduction
A host of natural electric phenomena occur on the surface of the earth and in its atmosphere. Similar electric phenomena are also seen in other celestial body systems. These include formation of geomagnetism, ionosphere, electric field in the auroral belt, formation of Van Allen Radiation Belt (Proton belt), electric field in magnetopause, electric field in lower atmospheres, fair-weather electricity (air-earth current), horizontal and vertical earth current, thunderstorm electricity, tri-pole electric structure in the rain cloud etc.. The natural electric field is also subject to variation responding to solar flare, lunar transit and during the storm and the dust haze. Independent analysis of the different natural electric phenomenon could not provide satisfactory answer. For example, after about 200 years of active research, it is not yet clear as to whether the thunderstorm electricity is caused by the movement of the positive charges by convection in the upward direction or by cloud precipitation charging mechanism. The present levels of understanding of the charge phenomena in both micro and macro domains are not very clear and the proposed theories are not very consistent for a complete answer. Scientists are keen to make an integrated study of all electrical phenomena taking place in the atmosphere for a clear understanding. Independent studies on different events have generated volumes of literature describing the specific events. This article makes a selective study and attempts to describe the exact nature of electric field structure from the available (published) data covering the surface of the earth and the upper atmosphere. This new finding will not only help to build a complete understanding through an integrated study of the entire field structure of the earth but also it would help in generalizing the charge features in other celestial bodies.
Charge State of Earth’s Surface
Ordinarily the surface of the earth is considered to be charge neutral. At the same time it is well known to the geoscientists and atmospheric physicists that the surface of the earth is negatively charged. Facts revealing its negative charge state are many. There exists a vertical potential gradient at ground level with an average electric field of 100 volts /m [1]. Any earthed electrode if raised into the atmosphere attracts positive charges from the surroundings showing a negatively charged electrode effect [2]. Again there is always a constant flow of positive charges from the atmosphere to the earth in fair weather condition. This vertical electric current associated with fair-weather field has a mean density of 3 x 10-12 amp. per square meter and a total current of 1500 amp. flows into the earth [3]. According to some other estimate this air-earth current is about 2000 amp. [4]. Between the negatively charged surface of the earth and the positively charged atmosphere there is a steady potential difference of 300,000 volts [5]. The fact that the surface of the earth remains always at a negative potential in spite of the constant inflow of positive charges ( i.e. negative charges from earth to air ) has been a surprise to many atmospheric physicists. Some have tried to explain the fair-weather current by assuming that the positive charges flow from ground to air during thunderstorm. However, the rain currents, corona discharge and lightning all assumed to be contributing to upward charge flow are found not enough to balance the fair-weather return current. Thus the earth being at a negative potential by some unknown cause appears most fundamental which give rise to other observed phenomena. We do not know as yet why and how the electrons are negatively charged, but we are successful in dealing with the electro-dynamics. Likewise we will deal with the planetary electrodynamics leaving the mechanism of negative charging to be understood at a later date.
Charge Shell Structure of Atmosphere of Earth
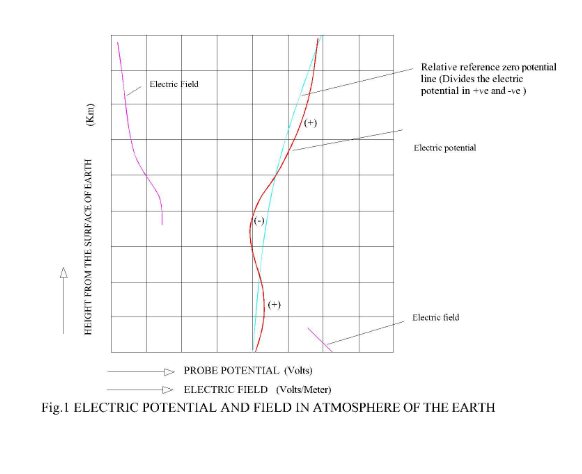
Many scattered information on the electric potential and electric field in the atmosphere of the earth are now available. The positive electric field in fair-weather condition goes on decreasing with height. The maximum potential of about 300,000V occurs somewhere near 50 km from the ground level. Thereafter the potential goes on decreasing. A negatively charged layer near 94 km has been confirmed by Rocket Borne Mass Spectrometer experiment (Aerobee NRL24) through the study of ion composition in the ionosphere on 29 Nov. 1955, while moving between 93-131 km (normal E-region).It noticed the presence of 46– (NO2) 46-97%, 32– (O2), 22– ( ? ) and 16– (O) without any positive ion spectra [6]. Lack of positive ion spectra has not been satisfactorily explained [7, 8, and 9]. The electric potential and the field between 30 km to 200 km are shown in (Fig.1). The good electrical conductivity of E region may be caused due to the mobility of free electrons without much hindrance from the positive charges. It is also noticed that the recombination coefficients and the attachment coefficients are assumed to vary considerably as they are required to justify the observed electron density during the day and the night following the existing concept of the formation of ionosphere.
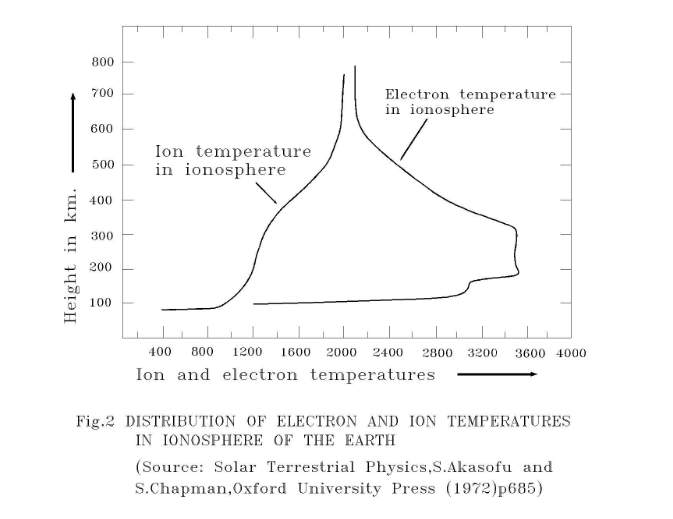
Beyond 200 km, direct measurement of potential is not available in literature. Hence, different techniques may be employed to establish the charge states of the high atmospheres. The ion and electron temperature in neutral plasma (at constant pressure) is a measure of the charge density. At sub-atmospheric pressure, the electron temperature greatly differs from the ion-temperature but both shows an increasing trend with increase in charge density i.e., both ion and electron density rise together and fall together. This phenomenon, however, does not occur in the ionosphere. It is interesting to note that in ionosphere, the ion and electron temperature consistently show a different trend. The maximum ion temperature coincides with the minimum electron temperature and the minimum ion temperature coincides with the maximum electron temperature (Fig.2). How can this happen in neutral plasma? It becomes obvious that, for a positively charged ionosphere the ion temperature reaches a maximum with a corresponding minimum of electron temperature. Likewise for the negatively charged ionosphere, the electron temperature has a maximum with a corresponding minimum ion temperature. (Fig.2) shows the ion and electron temperatures measured between 100 and 700 km of altitude. From (Fig.2) it is seen that at about 94 km the electron temperature has a maximum peak and the corresponding ion temperature has a minimum giving rise to the formation of a negatively charged layer at this height. The Aerobee NRL 24 experiment also conforms this hypothesis. Also the direct field measurement shown in (Fig.1) reveals this fact. This technique may now be used to identify the positively and negatively charged layers from the records of the ion and electron temperatures. We notice, at 188 km, the ion temperature has a maximum peak coupled with a minimum of electron temperature and hence it can be said to be positively charged. Likewise, following (Fig.2), we find an electron temperature maximum coupled with a minimum ion temperature again at 374 km which states the existence of a negatively charged ionospheric shell. Surprisingly, once again at 728 km we also notice a positively charged ionosphere from the above logic.
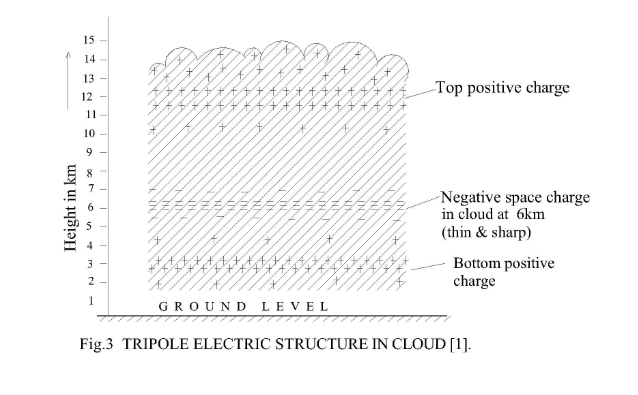
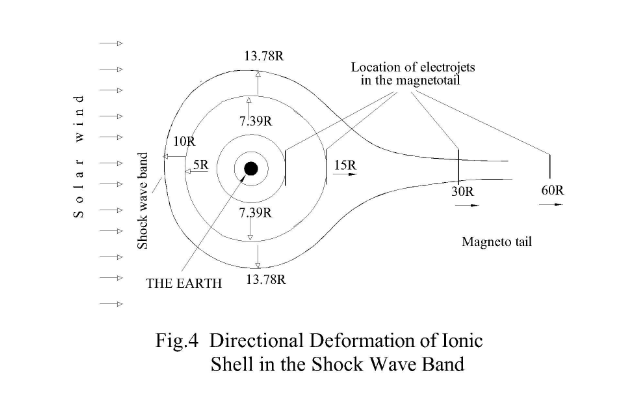
Above 750 km, the ionosphere has not been surveyed properly. The radio frequency wave return technique is ineffective as it is difficult to send signals through E and F2 layers of ionosphere. Signals entering from outside F2 region for ionospheric cross modulation studies are less effective as most waves return outwardly. Above 10,000km study through rocket technology and artificial satellites have made some progress. An auroral potential structure is found existing at an altitude ~ 10,000 km above the aurora [10]. This potential structure was discovered in 1977 and it was found to be a very strong source for radio emissions called the auroral kilometric radiations (AKR). It was a satellite borne radio device that first detected these intense waves. Interesting electric potential structures with a potential drop of few kilo volts/meter appear to develop at an altitude of 10,000 km [10]. Again the region inside the structure appears to separate into positively and negatively charged layers producing a strong electric field between them [11]. Electrons seem to be accelerated downward in the electric field that accompanies the double layer [11]. Investigators at the Lockheed Missiles and Space Company have confirmed that the auroral potential structure also accelerate positive ions upward [11]. From the above (motion of electrons and positive ions) it is clear that the ionospheric layer at altitude about 10,000 kilometres is positively charged and that at about 20,000 km is negatively charged. Above 20,000 km from the surface of the earth two more ionospheric charge belts are seen to stand which are popularly known as Van Allen Radiation Belt and the magnetospheric shock wave band. Let us now examine the charge state of the Van-Allen-Belt (proton belt) and the shock wave band. No direct information about the charge state, charge gradient or ion-electron temperatures of these two belts are available. However, the dominance of solar proton in Van-Allen-Belt gives some indication of its dominating positive charge. We shall adopt a new technique to establish the charge state. Surveying the structural features (i.e. the shape and size features) of positively and negatively charged ionospheres, we find that, the negatively charged E and F2 layers are seen to have narrow and sharp geometry with well defined peaks while the positively charged ionospheric layers are more diffused with less conspicuous peaks. Similar features are also noticed (Fig.3) in the charge structure (tri-pole structure) in the cloud [12]. The negatively charged cloud layer is thin and sharp which resembles a pancake type structure while the positively charged layer is more diffused. Employing the shape features, one may characterise the ionospheric shell as to whether it is positively or negatively charged. The magnetospheric shock wave band is narrow and sharply defined and therefore may be taken as negatively charged. On the other hand, the Van Allen Radiation belt is diffused without a sharp peak and may be considered as positively charged ionosphere. The height of Van-Allen-Belt is ~ 5 earth’s radii and that of the shock-wave-band is ~10 earths radii measured in the direction of the sun. These ionospheric shells are greatly deformed by the impact of the solar wind. Thus, the height measured in different orientation is found different 7(Fig.4) shows the deformation of the shock wave band ionospheric shell. Beyond the shock wave band, the ion-shell structure is considered nonexistent. However, if one imagines the existence of ion shells beyond the shock wave band, he may have to look for charge events in the magnetospheric tail. The electro-jets recorded in magnetospheric tail at distances of ~7R, ~15R, ~30R, ~100R reveal the presence of charged ion-shells at these distances.
Analyzing the occurrence of ionic shells, it is seen that the placement follows some definite norms. The positive and negative charge shells are arranged alternately. The distances of charge shells goes on expanding outwardly in a G.P. series given by-
Dn = C2n (1)
Where, Dn is the distance (in kilometers) of the nth ionospheric shell.
C is a constant and is equal to 46
(It is the distance of the 1st positive shell from the surface of the earth).
n is an integer which can have values as 0, 1, 2, 3……
The value of n = 0 for the first positive shell from the surface.
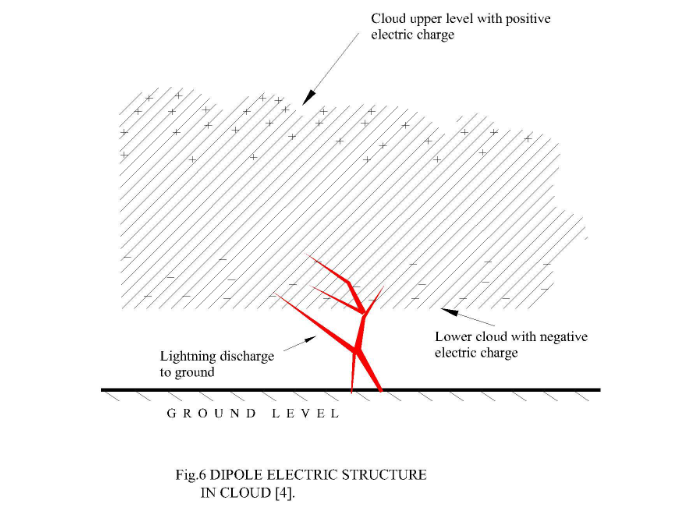
The distances of ion-shells vis-a-vis the computed distance and the nature of charge states are presented in Table.1. A more conceptual picture of ionospheric shells is shown in (Fig.5). It is seen that one of these shells houses the earth’s satellite, the moon, as if the orbital bodies are more stable at these ionospheric shell locations. It is natural that when the electric potential is maximum or minimum, the electric field is zero. Thus, in a zero field, the drifting electric forces are absent. The placement of orbital bodies in G.P. series has also been identified by the author elsewhere [13]. Over and above the already identified electric main field structure, many secondary field structures are also seen to exist within these main fields. This happens due to the presence of non-homogeneous dielectric medium. For example, the rain cloud has a higher electrical resistance than that of the air. Thus, if a layer of cloud is introduced into the normal atmosphere, it develops a modified electric potential structure between the main ionospheric shells. Positive charges build up at the upper levels of the cloud while negative charges develop at the lower level of the cloud (Fig.6). Similarly the gravitationally stratified layer structure of atmosphere having different composition and dielectric constant give rise to secondary field structure as noticed within the D, E, F1 and F2 layers of the ionosphere. It is interesting to note here that the spacing of the ionic sub-shells within the main shells also have an increasing order of spacing (Fig.3).
TABLE-1
CHARGE STATE OF THE EARTH’S SURFACE
AND DIFFERENT IONOSPHERIC SHELLS
Observed distance from the surface in km. or R* | Distance computed from G.P. series in km. or R* | Nature of charge polarity | Related events/ features |
0 ~50 94 188 374 728 …? …? …? ~10,000 ~20,000 $5R #7R $10R #15R 30R ? 60R ? 100R …..? …..? …..? | 0 46 92 184 368 736 1472 2944 5888 11776 23552 7.39R 14.78R 29.56R 59.12R 118.24R 236.48R 472.96R 945.92R | -ve +ve -ve +ve -ve +ve -ve +ve -ve +ve -ve +ve -ve +ve -ve +ve -ve +ve -ve | Earth’s surface 300000 volts Ionosphere (E) Ionosphere (F1) Ionosphere(F2) Auroral events Auroral events? Auroral events? Auroral events Auroral potential Auroral potential Van Allen radiation belt. Magnetosphere Electrojet in magnetotail Orbit of moon Electrojet in magnetotail …..? …..? …..?
|
R = radius of the earth (6370 km), $ -sun facing side, # -magneto tail side

Conclusion
The earth and its atmosphere is not charge neutral. The surface is negatively charged and all ionospheres are electrically charged with alternate positive and negative polarity. Again, the spacing of the ion-shells go on expanding outwardly in geometric progression. The nature of spacing of ionospheric shells and the placement of planets in solar system appear to have a fair similarity. This global pattern of charge field structure needs integrated study to promote our understanding of atmospheric science.
This article is a part of the original work published in the book “Planetary electrodynamics-I”, Volume-1 of the series “Dynamics of universe; interplay of matter, space and charge”, 1998 by the same author.
References
- Bates, D.R., in `Physic of the upper atmosphere’ Ed. J.A. Ratcliffe 3rd printing 1972, Academic Press, New York, p.421.
- Hutchinson, W.C.A., `Planetary Electrodynamics’ Vol.1, Section 1, Page 27, Ed. S.C. Coroniti and J. Hughes, Gordon and Beach Science Pub.1, New York, 1969.
- Encyclopedia-BRITANNICA, Vol.8, p-184 (1964) Pub. William Benton, London.
- Williams, E.R., Scientific american, Nov. 1988, p.48.
- Ibid 3rd Column & 1st paragraph p.65.
- Newell, H.E., Jr. In `Physics of the upper atmosphere’ Ed. J.A. Ratcliffe, 3rd Printing, 1972, Academic Press, New York, p.117.
- Newell, H.E. and Siry, J.W., J. Amer. Rocket Soc. 23 7(1953).
- Boyd, R., and Seaton, M.J.,Ed.`Rocket Exploration of the Upper atmosphere’Pergamon Press, London, 1954.
- Newell, H.E., et al. in `Sounding Rockets’ Mc Graw Hill, New York 1959.
- Akasafu, S.I., in `Encyclopedia of Physical Science and Technology’ Vol.2, p.312 and 318, Academic Press, New York, 1987.
- Akasafu, S.I., Scientific American, May 1989, 54.
- Williams, E.R., Scientific American, Nov. 1988, p.50.
- https://philosophyofnature.org.in/extrapolation-of-bodes-lawtowards-unravelling-the-mysteries-of-the-solar-system.
- B.C. Mohanty, Planetary Dynamics-I, of the series Dynamics of Universe Interplay of Matter, Space and Charge, Volume-1, ISBN 81- 900989-0-x.

Very nice article of polarization of Atmosphere of Earth with scientific data.
Very nice article.This article is very useful for us.
What you’ve written here speaks not only to the mind but also to the soul, offering a sense of peace and understanding.